Outcome of 1st Experiment

Buying lotto for March 6th was a failure. I bought lotto tickets for 980 DKK, and I only won twice, resulting in a return of 110 DKK, which is 11% of the paid amount. This poor result was hardly a surprise, since March 6th had the lowest score (just above zero) in the prediction curve. Anyway, the bad result for March 6th made me change my approach - the rest of the month I did not buy for more than 240 DKK on a given date. March 13th I also bought a lottery ticket, but it was not part of this experiment.
The rest of the dates in the illustration I spent 240 DKK each date including April 2nd, which was part of the wave, 5 dates all together. Altogether I spent 1200 DKK. 45% of this amount is paid out as winnings - the same as 540 DKK. How much did I win? 404 DKK. Seen from a pecuniarly perspective, the experiment was a failure.
- March 20th: One win of 71 DKK
- March 22nd: Two wins of 50 and 60 DKK
- March 30th: Two wins of 51 and 60 DKK
- March 31st: One win of 56 DKK
- April 2nd: Two wins of 56 and 60 DKK
But what about the frequency of winnings? With 1200 DKK invested, I would under normal circumstances expect to win 4 times, since there is a win for every 300 DKK invested. But I won 7 times. Seen from a frequency perspective, the experiment was a success, since I won every 3rd time instead of winning every 5th time. This pattern - with winning every 3rd time instead of winning every 5th time - often occurred, when I used "my old lotto system", which only consisted of electional charts - as an example shows below.
The problem is of course that the wins were too small.
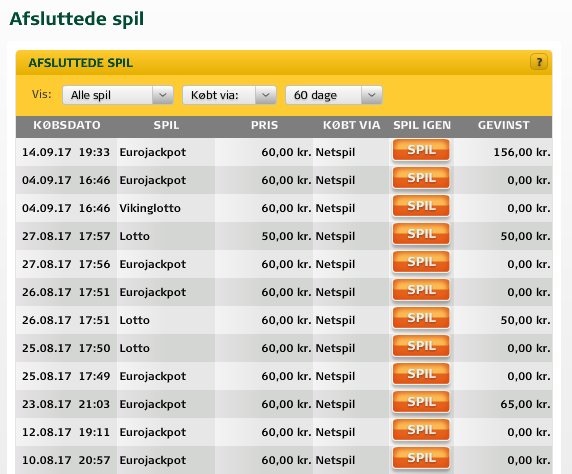
Figure 1: Example of winning every 3rd time with my old lotto system in 2017.
Improvements to the System
As I have mentioned initially this lotto system can be improved all the time, both when I loose and when I win. And I can add data from other people as well.
I added my own data from March - and 8 big time winners, whose wins of course got more weight than my own small wins. The result can be seen in the below bar diagram:
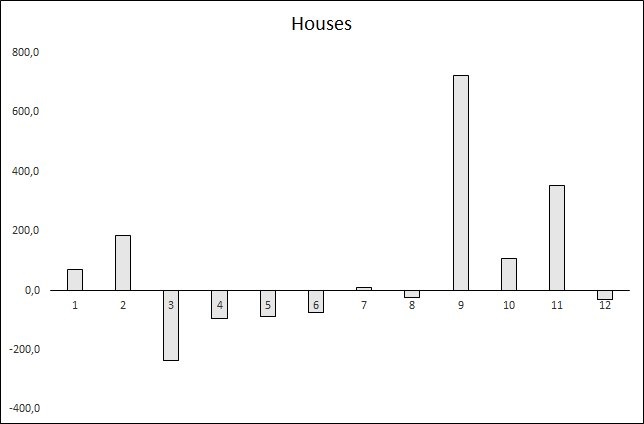
Figure 1: Distribution of house-ruler aspects
Observations:
- The favorable aspects with the 9th house rulers (Jupiter and the ruler of the 9th house in the natal chart) play the most dominant role. In fact, the 9th house has increased considerably since I made the first equivalent bar diagram.
- Favorable aspects with the 11th house play the second most dominant role and have also increased since the first equivalent bar diagram was made.
- The 3rd house ruler, which initially was positive, is now markedly negative, thereby indicating that unfavorable aspects to Mercury and the individual 3rd house ruler may actually promote wins.
- The 2nd house, which initially was neutral, is now prominent regarding the favorable aspects.
- The 5th and 8th house have lost their prominence.
Altogether it is an altered picture we see since my first attempt.
The new results make it much more easy to select dates for buying lottery tickets, since the outcome of such purchases primarily depends on the 9th house aspects.
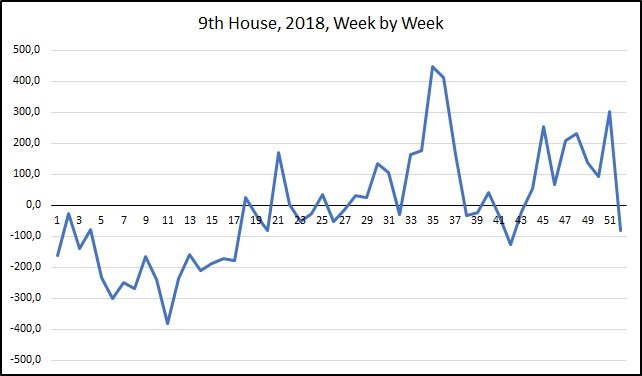
Figure 2: Aspects to 9th House Rulers
In Figure 2 I have isolated the aspects with my 9th house rulers (Jupiter and the ruler of the 9th house in my natal chart).
The diagram shows:
- My experiment in March 2018 did not have favorable 9th house aspects.
- April 2018 isn't promising either, when it comes to lottery experiments.
- From May 2018 there might be singulare dates, which are favorable.
- The second half of July, August, November and December are the best coherent periods for buying lottery tickets.
Conclusion: This experiment will continue - but the next results will not be published before some time in June 2018 at the earliest.
Scrutinizing May 2018
If I isolate my 9th house aspects for May 2018 I get a diagram as displayed in Figure 3. Remember, the balance is about positive and negative 9th house aspects.
If I use the aspects from May 2018 as input for my small neural network, I get a result as displayed in Figure 4. Remember, this diagram is about the distance between my personal aspects and the aspect present in the lives of 6 lottery winners, when they won a big price. That's why the zero bar seems to be raised in Figure 4 compared to Figure 3.
The flows in the two curves are almost identical, because the 9th house now plays such a prominent role for the outcome of the neural network.
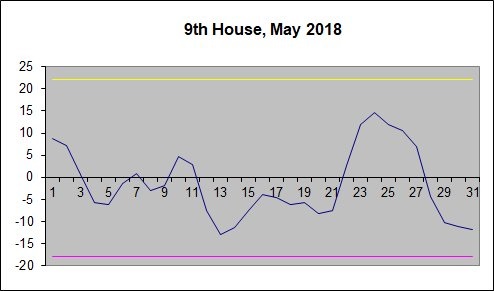
Figure 3: 9th house aspects in my chart for May 2018
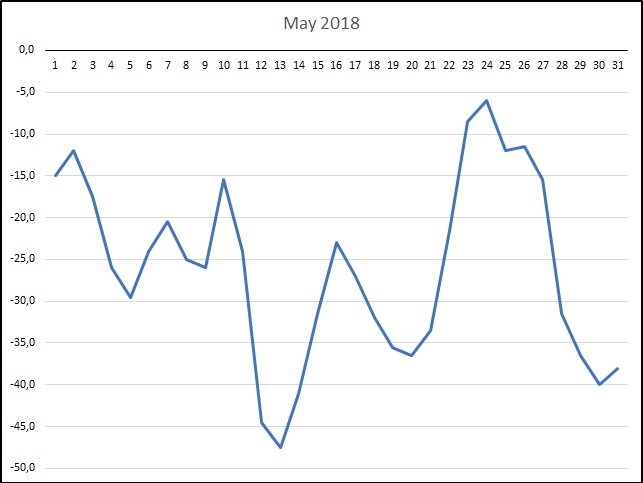
Figure 4: Output from neural network for May 2018